How to load a ready-made trading strategy
Logic and trading strategy rules are stored in 2 files:
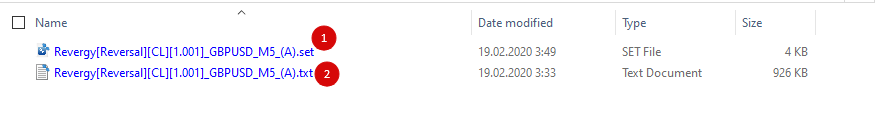
1. MT4/5 set-file (file with an extension .set) is used to save and restore specific EA settings (parameter values).
2. BelkaMiner config file is a txt file containing the results of clustering and machine learning. It is located in the ‘Common\Files‘ directory. It’s a common directory for all MT4 and MT5.
So to backtest/trade a ready-made strategy, you need to load its set-file into the MT4/5 terminal and copy the corresponding config file to the ‘Common\Files‘ directory:
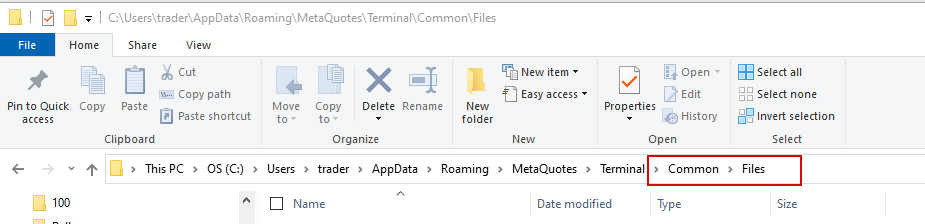
File -> Open Data Folder -> Up to ‘Terminal’-> Common\Files
Or you can use the alternate path: C:\Users\%USERPROFILE%\AppData\Roaming\MetaQuotes\Terminal\Common\Files
How to mine your own trading strategy (+ examples)
There are currently 2 methods available:
A) Clustering (Unsupervised)
B) Neural Network (Supervised)
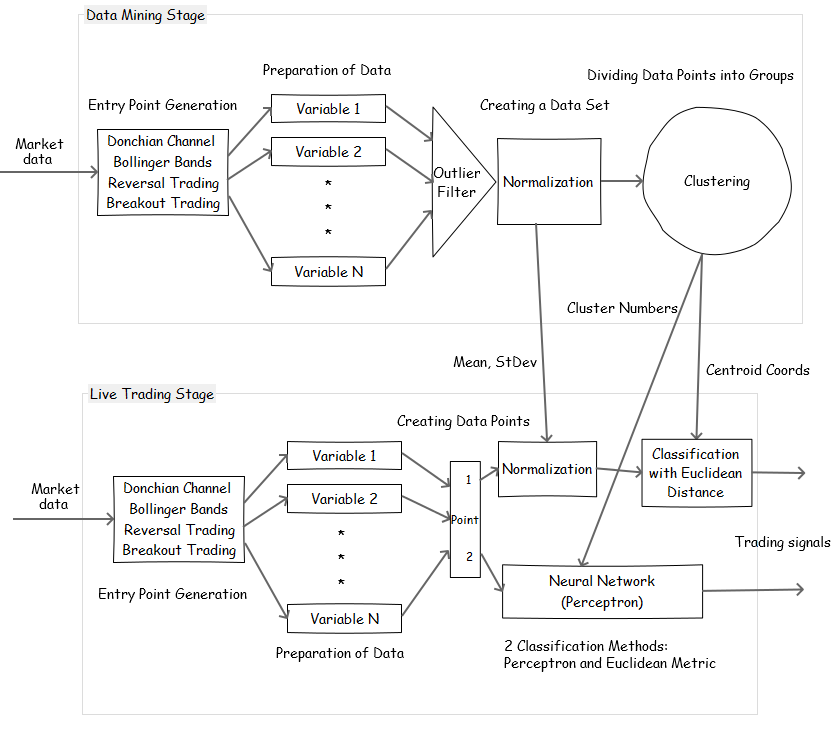
A) Clustering (Unsupervised) Method
The EA groups a set of entry points (dataset) in such a way that points in the same group (called a cluster) are more similar to each other than to those in other groups (clusters). Then we test each cluster and try to find profitable ones with good performance. We assume the points in the profitable clusters have certain properties that make them profitable. Clustering is a main task of exploratory data mining, and a common technique for statistical data analysis, used in many fields.
Unsupervised learning is a type of self-organized Hebbian learning that helps find previously unknown patterns in data set without pre-existing labels. Read more about Unsupervised Learning->
The algorithm of mining a robust strategy with ‘Clustering (Unsupervised) Method’ would be as follows:
I. Basic Rules
1) Parameter tuning. Don’t tune 2 or more parameters at once. Optimize only one parameter at a time because each parameter has its own meaning, logic, and features.
2) Use the Occam’s razor principle at every stage: ‘The simpler one is usually better.’ ‘More things should not be used than are necessary.’ The simpler your strategy, the more likely it will be successful in live trading.
3) Split historical data into an in-sample period used for parameter tuning, data mining, and an out-of-sample period used to evaluate performance. Do not touch the out-of-sample period until the very end of strategy creation! The OOS test should be run only once. If it fails, we have to start all over again. Don’t try to tweak anything to pass the OOS test. This rule may help to slightly reduce the risk of curve-fitting. But remember, out-of-sample testing is not the panacea.
*The market is changeable. Trading conditions, market participants, their methods, and algorithms change constantly. So I prefer to optimize strategies on the latest data putting the out-of-sample data earlier than the in-sample data. I’m not saying it’s a right or wrong way since there is no single truth in such matters. But in my opinion, if we use data from 10 years ago, we will have fewer chances to create a robust strategy that can be successful today. Of course, I know that this way increases the curve-fitting risk; I take this risk.
4) Disable spread (set it to a minimum possible value), commissions, and trading costs. Because in the first stages, the trading costs might prevent you from seeing reality – whether your basic idea works or not. If you don’t do this, you may throw out an excellent strategy or idea at the very beginning stage of development.
5) Do not use software like TDS2 or any slow and accurate testing method in the first stages. It is enough to use the fast ones ‘Open prices only‘ or ‘1-minute OHLC‘. This rule may save you a lot of time.
II. Creating the ‘White Box’ Model
1) At this stage, we need to build a basic strategy. The basic strategy is a simple ‘white box’ model (a white-box model is a system where all necessary information is available) based on boolean logic and clear rules, which gives us a lot of trades (not less than 3000-5000) with a very small but ‘stable’ avg. trade (EP/ME/EV). The white-box algorithm must have an ‘edge‘ that can be too small to be traded directly (can’t cover the spread, commission, once the costs are accounted for, the strategy becomes unprofitable), and can only be seen if the trading costs are turned off. It does not matter. The aim is many trades and stable growth without considering costs – the equity curve shouldn’t look like a random walk.
Why we need to use a basic strategy. IMHO (In My Humble Opinion)
The market is a non-stationary process. Many traders don't take that into account. What is non-stationary?
Non-stationarity means the statistical properties of a process generating time-series change over time.
Non-stationary data are unpredictable and cannot be modeled or forecasted.

A simple analogy. Imagine driving a car is a stationary process; if you follow certain rules, you'll get the expected result.
That's why it's so easy to learn to drive. Almost all math stats can only be used in stationary conditions.
If you use it with a non-stat. data - you're trying to hammer nails with a microscope instead of making great discoveries.

Let's imagine driving a car is a non-stationary process.
At the moment, to turn left you need to turn the driving wheel to the left, but the next minute (or second or hour)
the rules may change (no one knows how long the current rules will work and when they will change) so that to turn left
you should turn the wheel to the right. It is a non-stationary process - the rules constantly change,
and no one knows when & why they'll change next time.

What is a good trading strategy? In my opinion, there's only one right answer.
This is the strategy that can turn a non-stationary market process into a quasi-stationary process (whose probability
characteristics & statistical properties change in time slowly) by filtering the market:

Non-stationary: Market data (prices, indicators...) ---> Strategy ---> Quasi-stationary: Trades (PF, avg. trade...)

Only after the transformation, we can use various stat methods, including data mining.
A try to use ML/DM with a raw non-stationary market data will fail, no chance (broken microscope).
That's why we need to use a basic strategy. The strategy must have an 'edge', i.e., it must transform the non-stationary
market process into a quasi-stationary one (a growing equity curve with me=avg, and stdev=volatility).
2) Switch the EA to ‘BackTesting & Trading‘ mode and turn off Machine Learning (Use_Machine_Learning=false).
3) Select the currency pair and type of strategy you want to mine. The EA currently allows you to use 3 types: Reversal, Breakout, and Momentum.
4) The initial values of the basic parameters should be selected in such a way that your basic strategy has a small trading ‘edge’ and generates a lot of trades (not less than 3000-5000). For example, you can’t get many trades with a high PCh period or a long ‘time-stop’. So it will make you reduce them to the minimal possible value. You may change them after clustering (within reasonable limits, of course).
5) Backtest the basic strategy without considering trading costs.
*If you use TDS2 and put the in-sample data earlier than the out-of-sample data, then shift the start date to avoid historical data issues, for example, 2004/01/01 instead of 2003/06/01.
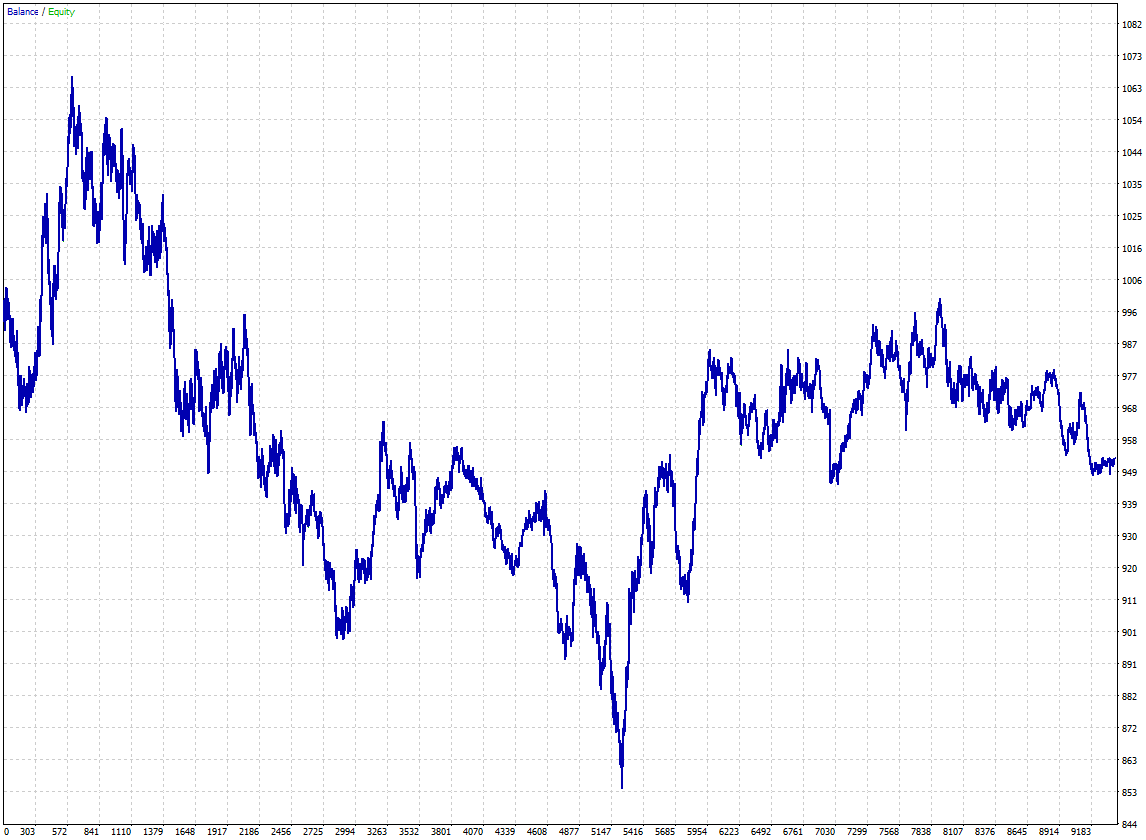
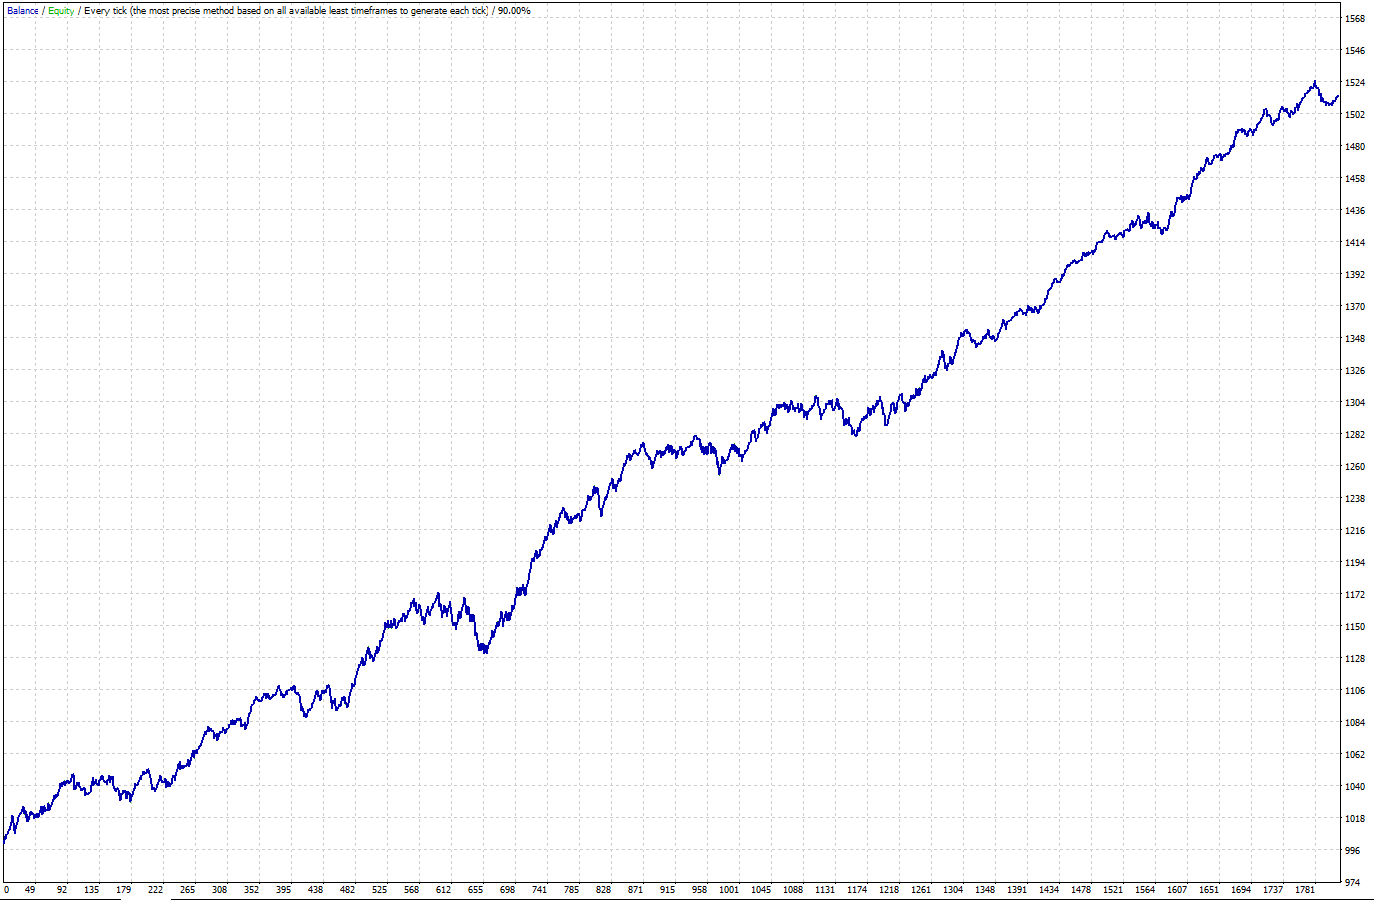
In my example, I will mine a reversal strategy on EURUSD, M5 timeframe. I use MT4 and MT5 with Dukascopy tick data (ask&bid). The data is split into IS (2010-2020) and OOS (2003-2009). How to Create a Custom Symbol and Import Tick Data into MT5 I selected values in such a way that the basic strategy generates about 9000 trades with a stable curve without considering trading costs:MT4 curve without trading costs:
MT4 curve with trading costs:
III. Clustering
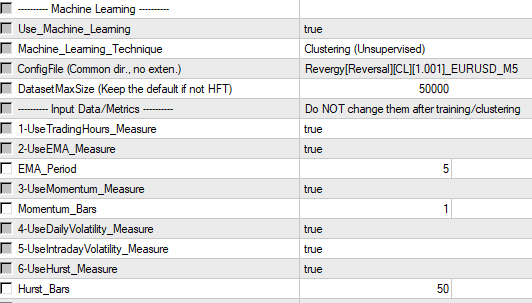
1) Switch the EA to ‘Machine Learning‘ mode, select Clustering (Unsupervised) technique and turn on Machine Learning (Use_Machine_Learning=true).
2) Select the metrics you want to use. I recommend clustering in two steps. In the first step, I recommend to select all the metrics.
*I’ve been using these metrics/predictors in many of my strategies/systems for over 10 years; I think they are robust and allow creating robust strategies. So the choice is based on my experience. Of course, I’ll add new ones in the future.
**Parameters EMA_Period, Momentum_Bars, and Hurst_Bars are not related to the basic rules (PA_Bars and etc). They are used to calculate input variables.
3) Set a clear name for the configuration file.
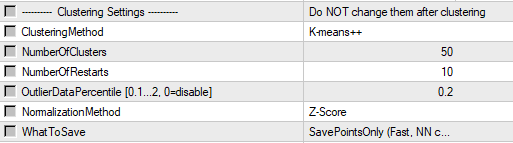
4) Specify the required number of clusters and the information you want to save to the configuration file (‘SavePointsOnly‘ is recommended). Leave the rest of the parameters at their default value. The optimal number of clusters depends on the dataset size (number of points/vectors).
Since I have enough trades, I set it to 50.
5) Run backtest, switch to the ‘Journal‘ tab, and wait a while.
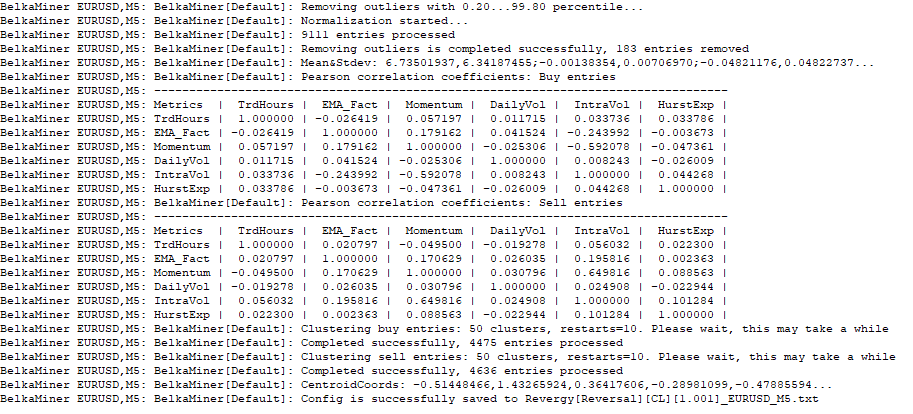
6) Proceed to the next step if the clustering is successful and the data is saved to the configuration file.
IV. Cluster Selection, ‘BlackBox’ Model Creation
1) The aim of this stage is to search for ‘profitable’ clusters. We test each cluster and try to find profitable ones with good performance. We assume the points in the profitable clusters have certain properties that make them profitable. However, a profitable cluster can be random. We know nothing about its work. In science, computing, and engineering, a black box is a device, system or object which can be viewed in terms of its inputs and outputs without any knowledge of its internal workings. That’s why we need the OOS test.

I recommend testing clusters on MT5, it's much faster.
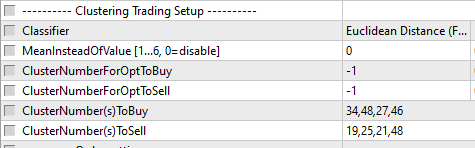
2) Switch the EA to ‘BackTesting & Trading‘ mode, and select the fastest classification method – ‘Euclidean Distance‘.
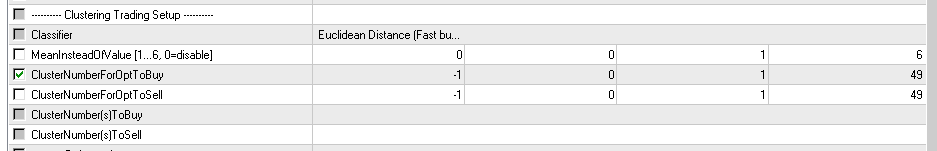
3) To test clusters for buy, optimize ‘ClusterNumberForOptToBuy‘ parameter from 0 to N-1. Be sure to clear ClusterNumber(s)ToBuy and ClusterNumber(s)ToSell before optimization.
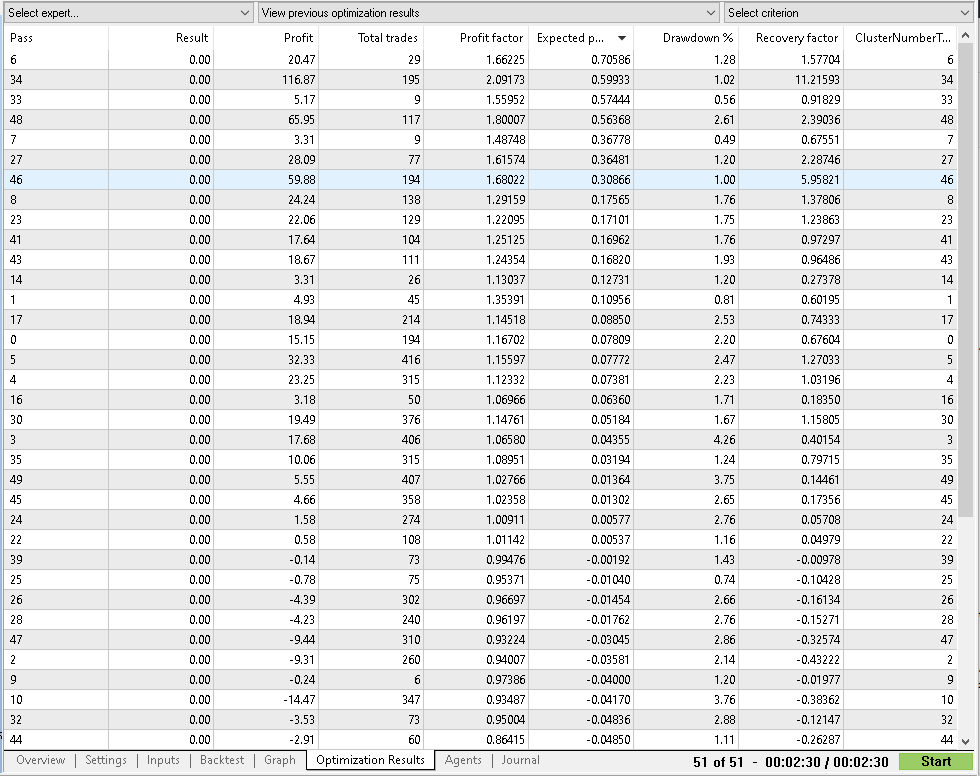
4) Select the cluster numbers for buy:
a) Sort the optimization results by avg. trade;
b) Select clusters with good performance (avg. trade, many points, recovery factor);
c) Don’t select clusters with a small number of points (less than 30);
d) Don’t choose many clusters, 2-6 is enough;
e) Allowed to test each cluster individually (IS only!);
f) If there are no good clusters, it means that clustering has failed or your basic strategy is too bad.
I selected 4 clusters: 34,48,27,46.
5) Do the same for the sell clusters.
6) Fill the ClusterNumber(s)ToBuy/Sell parameters with the selected numbers separated by a comma.
7) Enable trading costs and run backtest for the in-sample period, don’t touch OOS!
Looks good:
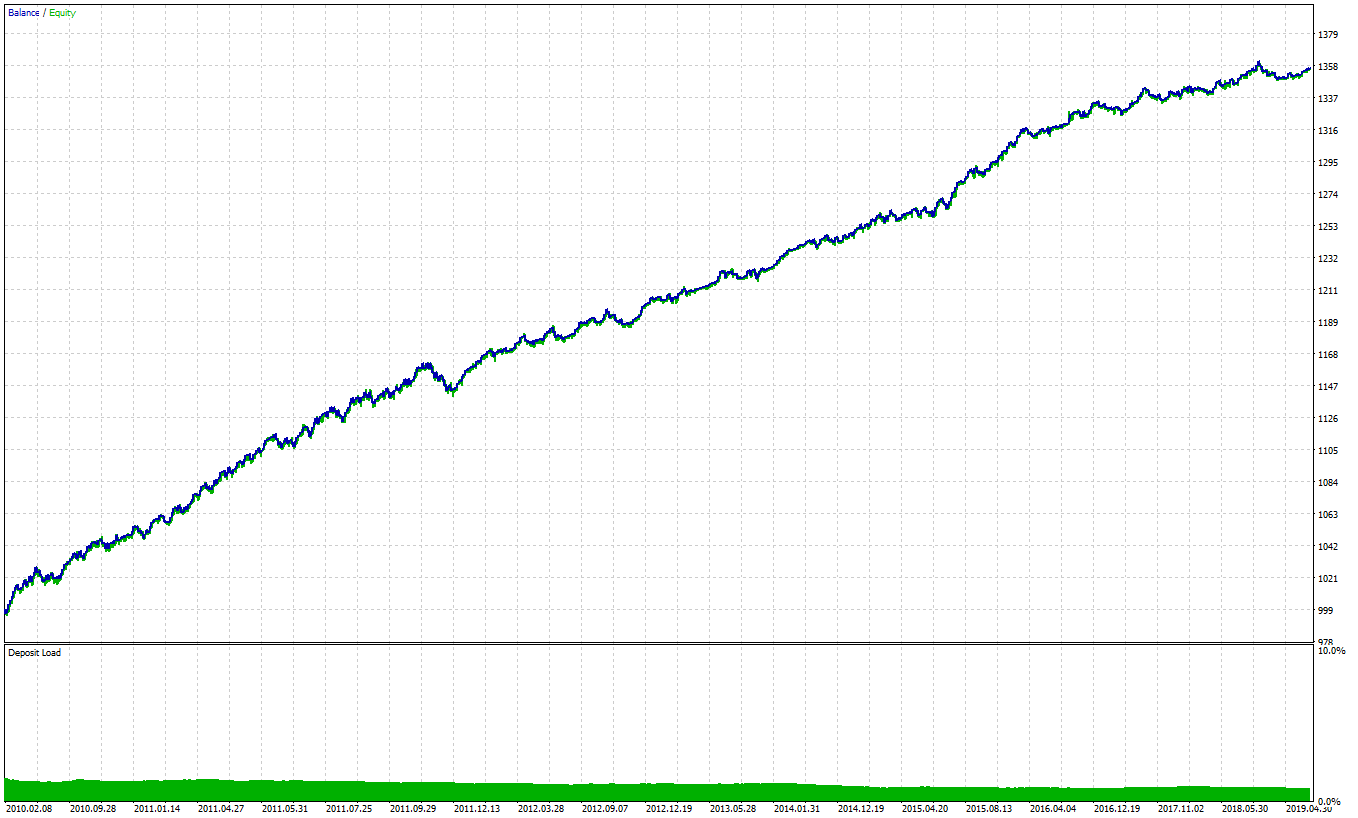
V. Basic Strategy Optimization
1) Optimize the basic strategy parameters if necessary. Don’t tune 2 or more parameters at once, optimize only one parameter at a time because each parameter has its own meaning, logic, and features. Read more: Model Parameter Analysis ->
2) Add complex exit rules if necessary.
I increased PCh period, SL(because it's a mean-reversion strategy), and time-stop: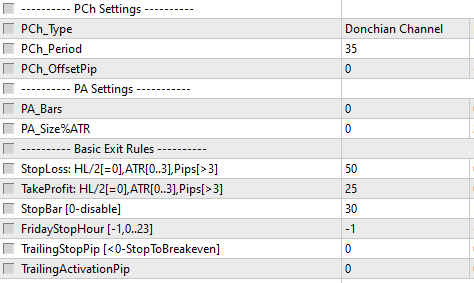
VI. Training Neural Network (Perceptron)
I recommend using MT5, it's much faster.
1) At this stage, we train the perceptron to classify cluster numbers and then save its configuration to the Config file.
*Parameter values contained in a set-file do not affect NN training as learning data is taken from the Config file.
First, try to train it with the default settings:
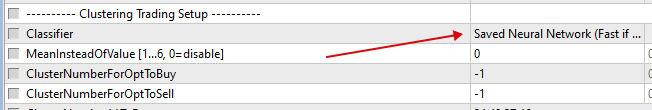
2) Set Classifier=Saved Neural Network and run backtest. Switch to the ‘Journal‘ tab, and wait a while.
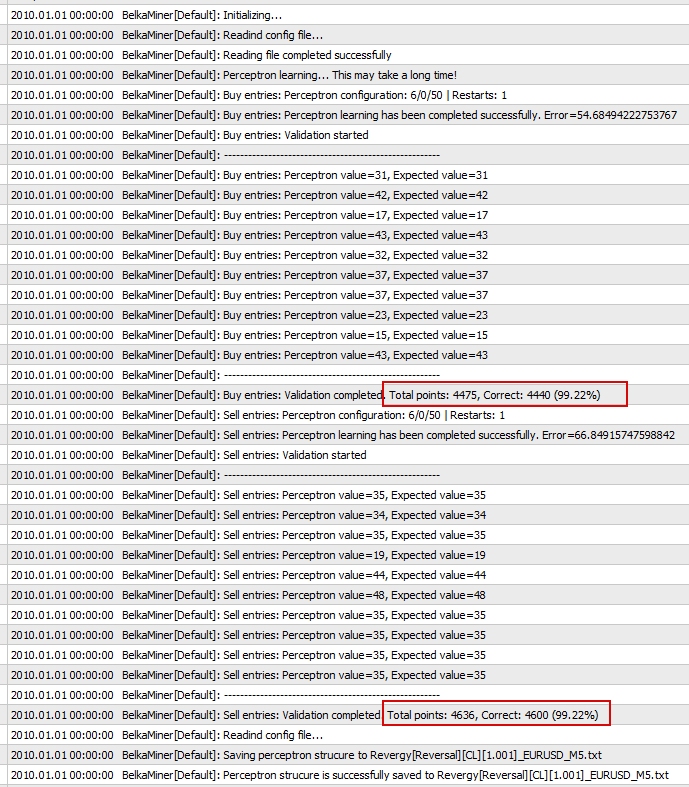
Note the accuracy, it should be at least 97-98%. After training, the NN will be able to trade using raw data!
3) If it fails, try to increase the number of restarts or add the hidden layer.
4) NN training is optional, you can use the ‘Euclidean Distance‘ classifier. But the neural network will be better able to identify the cluster number on unknown and raw data (in other words, on live data).
VII. Out of Sample Testing
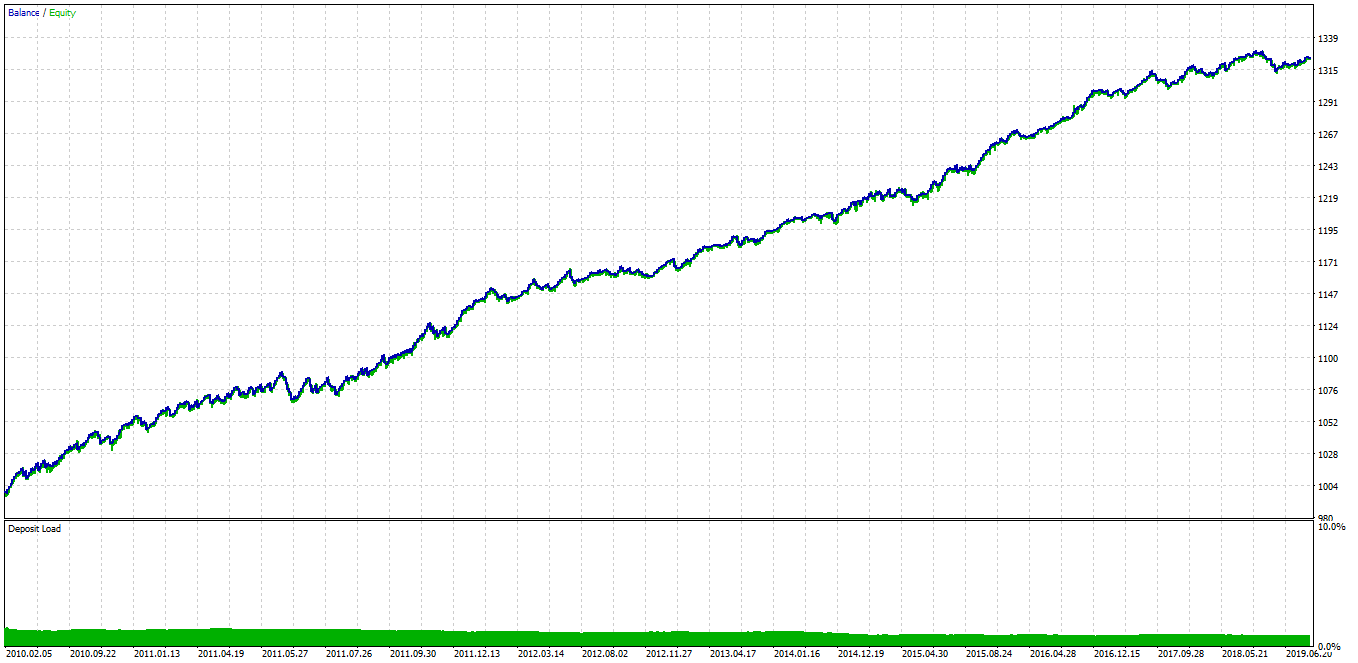
1) Perform the out-of-sample test with commission, real spread, slippage.
Dukascopy data (2003-2020):To make sure I didn't fit the strategy to the Dukascopy data, I conduct tests using other historical data. FXDD data (2005-2020):
Alpari data (2000-2020):
2) If the test is not passed, start all over again. Don’t try to tweak anything to pass the OOS test.
3) IMHO, due to the low accuracy of entries, a ML-based strategy will always look like an edge mixed with white noise. This will affect the PF value. However, there is also an advantage: deals of traders using the same edge will be significantly different. So I don’t think that white noise is a problem.
PS. The created strategy (Revergy[Reversal][CL][1.001]_EURUSD_M5) can be found in the Google shared folder.
PSS. As I mentioned above, I recommend clustering in two stages to exclude unused input variables. In the first step select all input variables. Then test the selected clusters by optimizing the MeanInsteadOfValue parameter from 0 to 6 (number of metrics used). Then compare the performance of the pass 0 with the passes 1-6. If performance grows or drops a bit, it means the cluster does not use this input variable and we should disable it and perform clustering again (step 2).
*For a simpler description, this strategy was created in one step.
B) Neural Network (Supervised)
The EA trains perceptron using raw data without clustering. Supervised learning is the machine learning task of learning a function that maps an input to an output based on example input-output pairs. Read more about Supervised Learning->
This method is less robust and brings extreme risk of over-fitting!

The algorithm of mining with ‘Neural Network (Supervised) Method’ would be as follows:
I. Basic Rules
II. Creating the ‘White Box’ Model
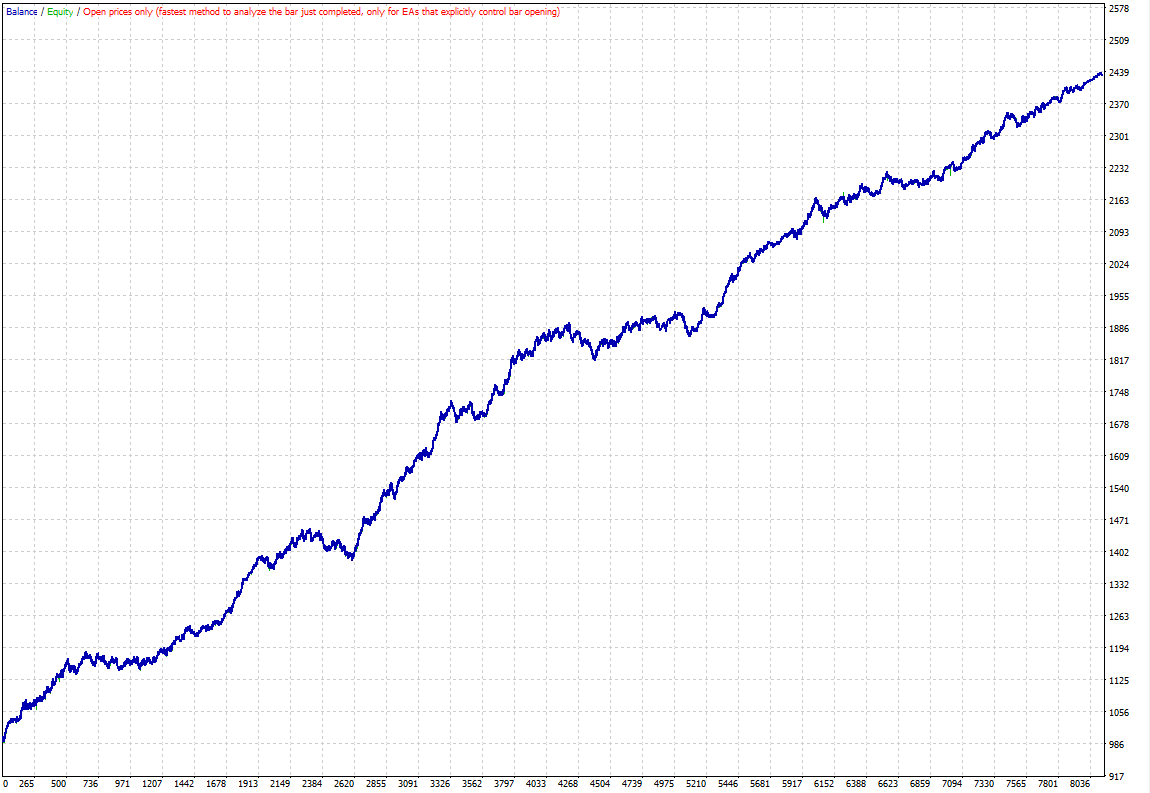
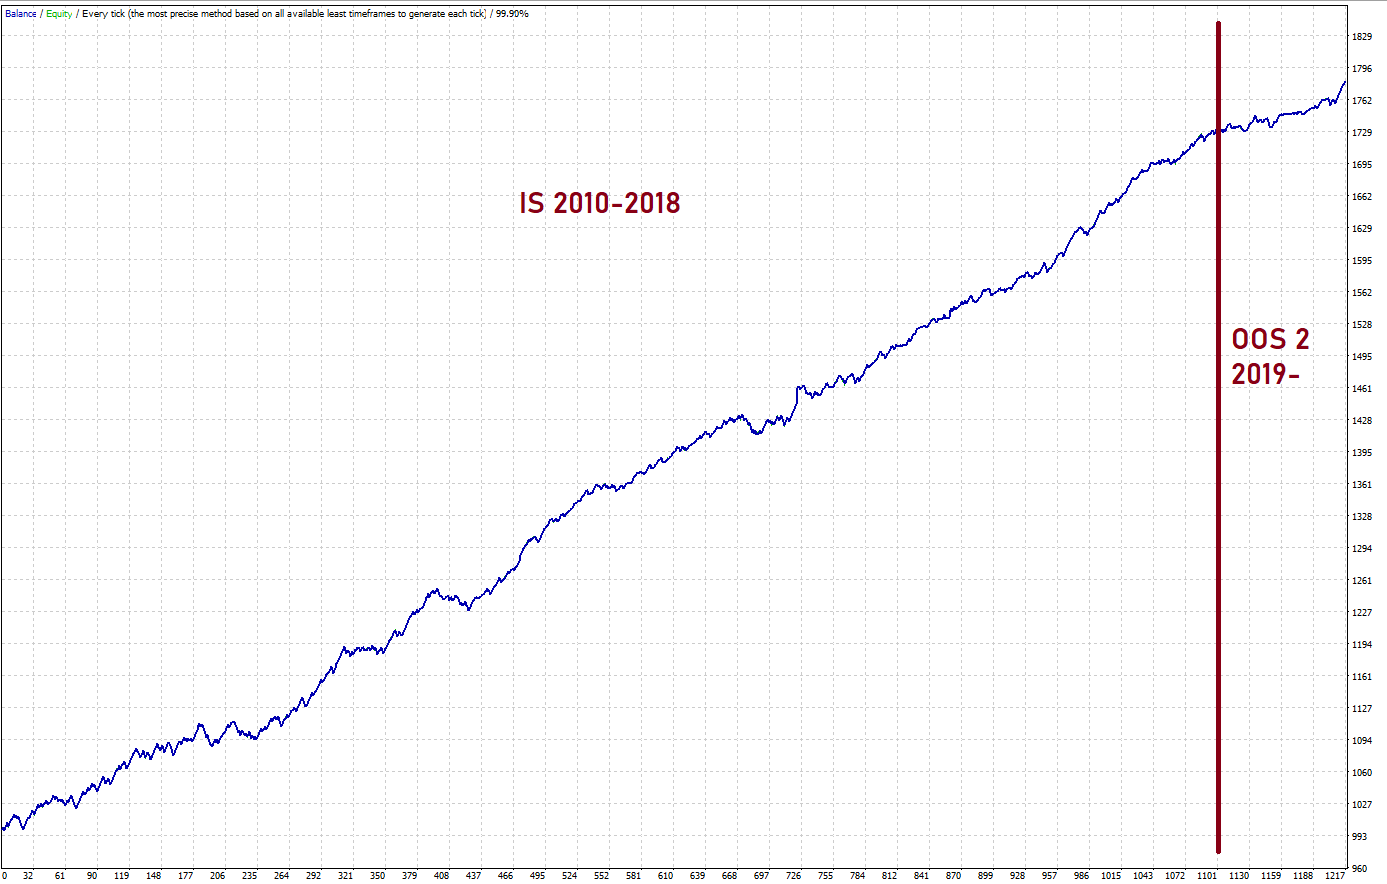
In this example, I will use the default settings of the EA (Default_EURUSD_M5) as a basic strategy.
The historical data is split into IS (2010-2018) and two OOS periods (2003-2009, 2019-2020).
How to Create a Custom Symbol and Import Tick Data into MT5

The basic strategy generates about 8000 trades with a stable curve without considering trading costs:
III. Training Neural Network (Perceptron), ‘BlackBox’ Model Creation
I strongly recommend using MT5, it's much faster.
At this stage, we train the perceptron to filter out losing trades. The training data consists of pairs of Inputs (metrics, input variables) and corresponding Outputs (PnL=Profit and Loss).
1) Switch the EA to ‘Machine Learning‘ mode, select Neural Network (Supervised) technique, turn on Machine Learning (Use_Machine_Learning=true), set WhatToSave=SavePoints & TrainPerceptron and Classifier=Saved Neural Network
2) Select the metrics you want to use.
In my example, disabling the 5-UseIntradayVolatility_Measure increases the accuracy on the training dataset.
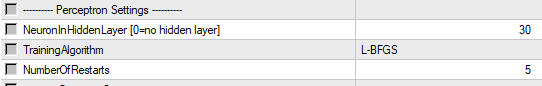
3) Set a clear name for the configuration file.
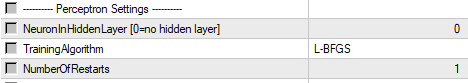
4) Configure the perceptron settings. For this task, I recommend using the hidden layer with 20-30 neurons.
5) Run backtest, switch to the ‘Journal‘ tab. Training may take a long time!
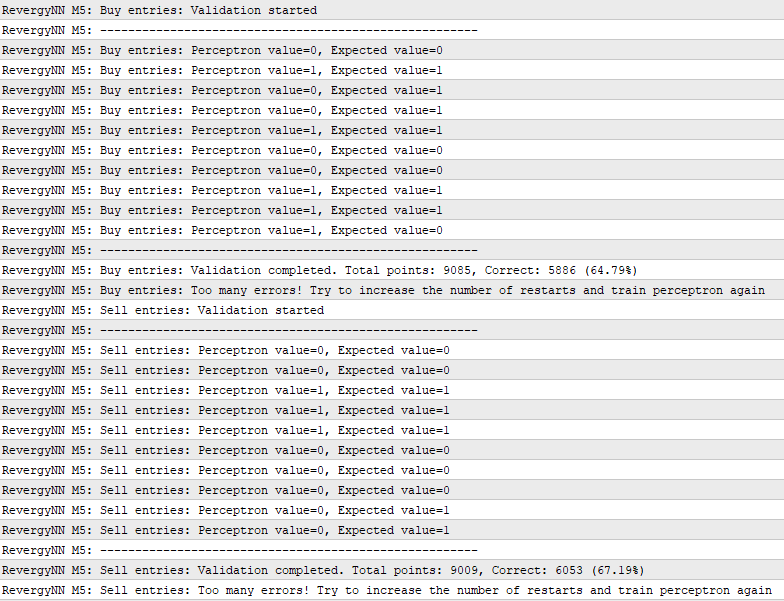
Note the accuracy, it should be at least 60-70%. For example, 70% means that the neural network correctly predicts the result (PnL) of 70% of trades. Predicting the outcome of trades is a difficult task, so the accuracy won’t exceed 80%.
6) Switch the EA to ‘BackTesting & Trading‘ mode.
7) Adjust the ProbabilityOfProfit% parameter. It works as a filter (the more you tighten it, the higher the performance, and the less the number of trades), so you can optimize it from 60 to 100 and select the desired value.
I set it to 70%
8) If you need to retrain the perceptron, set Classifier=Neural Network and run backtest. Then set the parameter back to Saved Neural Network.
*You can manually add entry points taken from different brokers by copying the data to the [Points and Cluster Numbers] section of the Config file. This allows you to increase the size of the training data-set and get the best result.
IV. Out of Sample Testing
1) Perform the out-of-sample test with commission, real spread, slippage.
Dukascopy data (2003-2020):Dukascopy data (2010-2020), ProbabilityOfProfit%=80:
2) If it is not passed, start all over again. Don’t try to tweak anything to pass the OOS test.
As can be seen, my strategy shows mixed results. It failed in the first OOS (2003-2009) and passed the second OOS test (2019-2020).
PS. The created set-file (RevergyNN[Reversal][NN][1.001]_EURUSD_M5) can be found in the Google shared folder.